
Last Saturday I stood between a Mazda CX-5 and a Honda CR-V in a dealer lot in San Jose, holding two spec sheets. Same price range. Both had good reviews. And that is exactly where most car comparisons fall apart. You put two cars side by side, the numbers blur, and you end up buying the one with the shinier paint. I have done this comparison routine dozens of times, and the trick is not collecting more data — it is knowing which numbers change your daily life and which ones are just noise.
Quick map of what I cover here
- What actually matters in a side by side car comparison
- The spec sheet numbers I check first (and the ones I ignore)
- How to structure a test drive so the comparison is fair
- True cost comparison beyond the sticker price
- Common mistakes I see buyers make
- FAQ: real questions from buyers comparing cars side by side
What Actually Matters in a Side by Side Car Comparison
Most online comparison tools let you line up two or three trims and spit out a giant grid. Cool. But a grid treats a heated steering wheel the same as a backup camera. In real life they are not equal. Here is my filter: anything that touches safety, seating comfort, or the monthly payment gets priority. Everything else is a tiebreaker.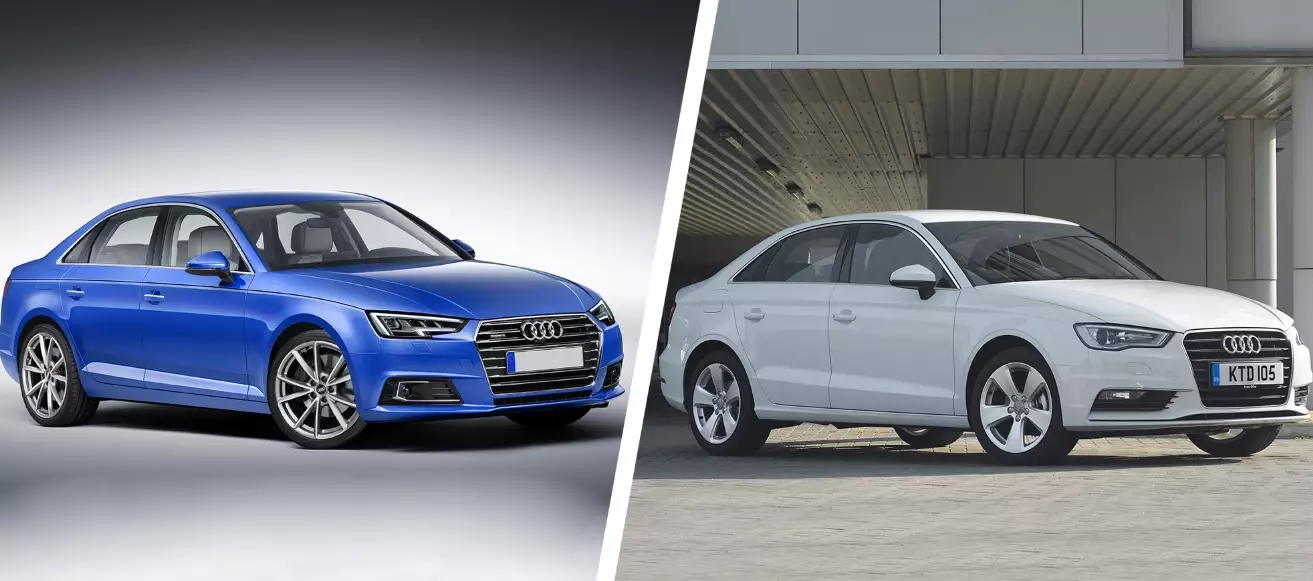
A quick example. I compared a Toyota RAV4 LE against a Subaru Forester Premium. The RAV4 had better fuel economy on paper (about 30 mpg combined vs 28 mpg). But the Forester had 8.7 inches of ground clearance and standard all-wheel drive — and where I live, that matters more than 2 mpg. Side by side, the EPA numbers look close. In practice, one car handles a snowy driveway and the other one spins. That is the kind of gap a spec grid hides.
The Spec Sheet Numbers I Check First (and the Ones I Ignore)
When I compare cars side by side, I run the same checklist every time. Here is a real comparison I did between a Hyundai Elantra SEL and a Kia K5 LX, both sedans, similar price bracket.
| Factor | Elantra SEL | K5 LX | Why it matters to me |
|---|---|---|---|
| Rear legroom | 38.0 in | 35.6 in | My kids sit in back; 2.4 inches is noticeable on long trips |
| Cargo trunk | 14.2 cu ft | 16.0 cu ft | Stroller test: the K5 fits it flat, the Elantra needs a shove |
| Combined mpg | 35 | 32 | At 12k miles/year, roughly $150 difference — minor |
| Warranty (bumper to bumper) | 5 yr / 60k mi | 5 yr / 60k mi | Effectively identical; not a deciding factor |
| Insurance estimate (annual) | About $1,650 | About $1,720 | Small gap, but worth checking with my own agent |
The table told me the K5 had more trunk space, the Elantra had more back-seat room. Those two facts caused more debate at my kitchen table than anything else. Fuel economy barely registered. That is the opposite of what most comparison websites emphasize.
What I skip on the spec sheet
Horsepower differences under 20 hp, zero-to-sixty numbers unless I am buying a sporty car, and cosmetic trim labels. I also ignore “available features” that require a higher trim I am not buying. That last one is a trap. A brochure says a car “offers” a 360-degree camera — but only on the top trim that runs $6,000 more. Compare the trims you can actually afford, not the brochure fantasy.
How to Structure a Test Drive So the Comparison Is Fair
Most people test drive one car, then drive the other an hour later, and the first impression fades. I book back-to-back appointments at dealerships within a few miles of each other. Same route both times. Same time of day if possible.
My route has four checkpoints: a rough patched road, a highway on-ramp, a tight parking lot, and a speed bump. Those four cover ride comfort, merging power, visibility, and suspension. When I drove the CR-V and CX-5 back to back, the CR-V soaked up the patched road better; the CX-5 felt sharper on the on-ramp. Neither win shows up clearly in a spec sheet. You feel it in your lower back and your right foot.
One detail I always check: seat height and door sill height. On the CX-5, the sill sat a bit higher, so my mother-in-law had to step up more. Small thing. Big thing if you haul older passengers weekly.
True Cost Comparison Beyond the Sticker Price
The sticker is the start, not the answer. When I put two cars side by side financially, I run a five-year estimate. Here is what I include:
- Insurance quotes: call your own agent with both VINs. Rates swing by hundreds of dollars between similar cars.
- Depreciation: check three-year resale estimates from a source like Kelley Blue Book or Edmunds. A car that holds value better can save thousands.
- Fuel or charging: use your real commute, not the EPA fantasy. I drive about 14,000 miles a year, mostly city, so city mpg matters more to me.
- Maintenance schedule: some brands include free maintenance for two or three years. That can be worth $500 to $900.
- Tire cost: a car with 19-inch wheels often costs $300 more per set than one with 17s. Nobody mentions this at the dealership.
I once compared a used Lexus ES and a new Camry at nearly the same price. The Camry won on warranty and fuel. The Lexus won on ride quietness and seat comfort. The insurance quote for the Lexus came in $340 higher annually — that tipped me toward the Camry. That number never appeared in any online comparison tool.
Common Mistakes I See Buyers Make
The biggest one: comparing different trim levels. You drive the top-trim demo car with leather and a sunroof, then buy the base model. The seats, the stereo, even the sound insulation can differ. Compare the exact trim you plan to buy.
Second mistake: trusting the dealer’s comparison sheet. Those sheets are marketing. I have seen one that listed a competitor’s horsepower but omitted its larger trunk. Check an independent source like the manufacturer’s own spec PDF or a site like Car and Driver’s buyer’s guide.
Third: ignoring the back seat during the test drive. Sit in the back for two minutes. Adjust the front seat like you normally would, then climb in back. If your knees touch, that is a daily annoyance for years.
And a subtle one — sound at highway speed. Turn the radio off. Some cars have a droning exhaust or wind noise that only shows up above 65 mph. I test this on the same stretch of highway every time.
FAQ: Real Questions From Buyers Comparing Cars Side by Side
When comparing two cars side by side, how do I weigh reliability against features?
Reliability wins over features almost every time for me. A panoramic sunroof is fun until it leaks. Check model-specific reliability data from Consumer Reports or RepairPal, not brand-wide reputation. A reliable base model beats a feature-loaded car that visits the shop twice a year.
Is it worth paying for a higher trim just to get one feature I want?
Do the math on the feature alone. If the higher trim costs $4,000 more and the only thing you care about is a better stereo, an aftermarket install runs $800 to $1,200. Skip the trim. But if the higher trim also brings safety tech you will use daily — blind-spot monitoring, adaptive cruise — the math changes.
How do I compare cars side by side when one is new and one is used?
Normalize the warranty and the total five-year cost. A used car with 20,000 miles left on the bumper-to-bumper warranty carries real value. Get a pre-purchase inspection even on a certified used car — I have seen certified cars with worn brake pads. Then compare monthly cost of ownership, not just purchase price.
What is the one number most buyers overlook in a side by side comparison?
Curb weight. A car that is 300 pounds heavier feels different in braking and steering, and it usually drinks more fuel. It also affects tire wear. Check it, especially if you compare a compact SUV to a sedan.
How long should I spend comparing before deciding?
Two weekends, minimum. One weekend for research and insurance quotes, one for back-to-back test drives on the same route. Rushing this step is how people end up with buyer’s remorse. I have never met someone who wished they had spent less time comparing.
This article was fact-checked against manufacturer spec sheets and independent reliability data. Dealer pricing and insurance quotes vary by location and should be verified directly.
Leave a Comment